Carbon intensity is a much-quoted, but deceptively nuanced metric. The banking sector needs to understand it fully for carbon disclosures and risk management.
Carbon Intensity is a common metric for comparative carbon auditing…
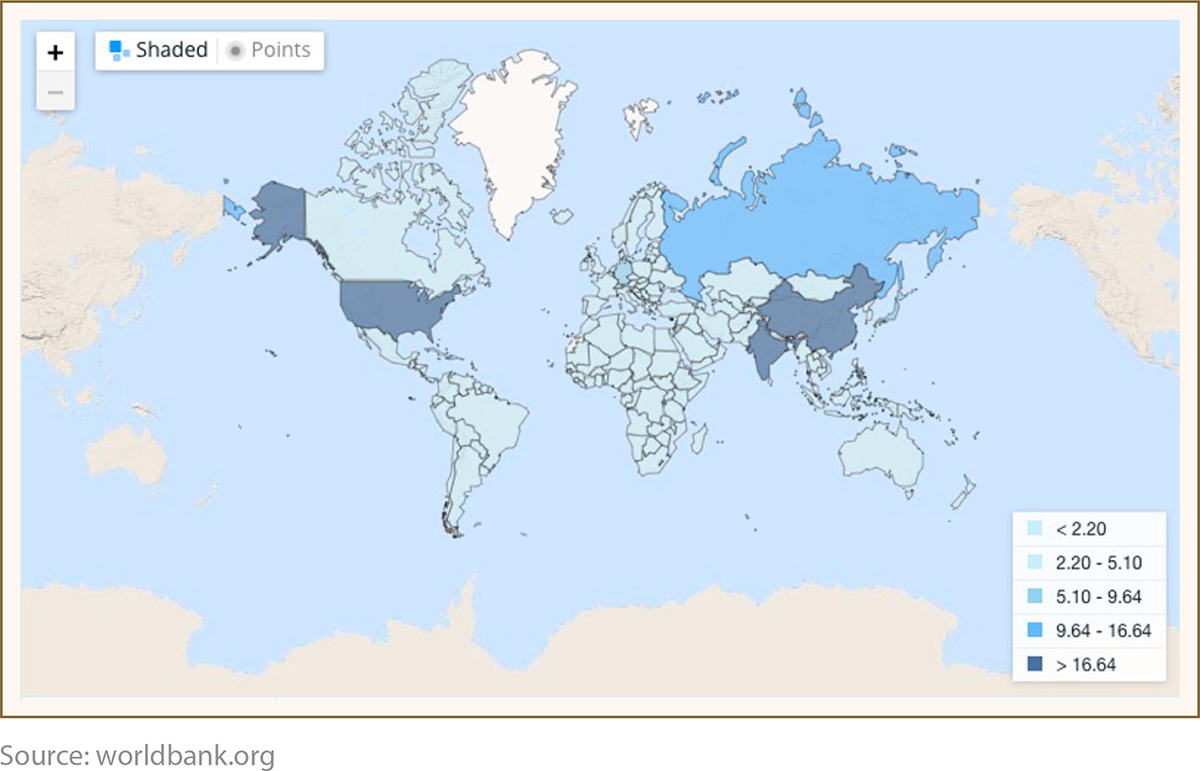
CI, as a metric, represents the amount of carbon emitted per unit of activity. This is typically expressed as ‘KgCO2 per unit’, with the unit being representative of the activity. CI is useful for comparisons and emission targets such as – when the global distribution of CO2 emission is considered.
2018 CO2 emission by country (from worldbank.org) shows the main industrial economies producing the most GHG in absolute terms.
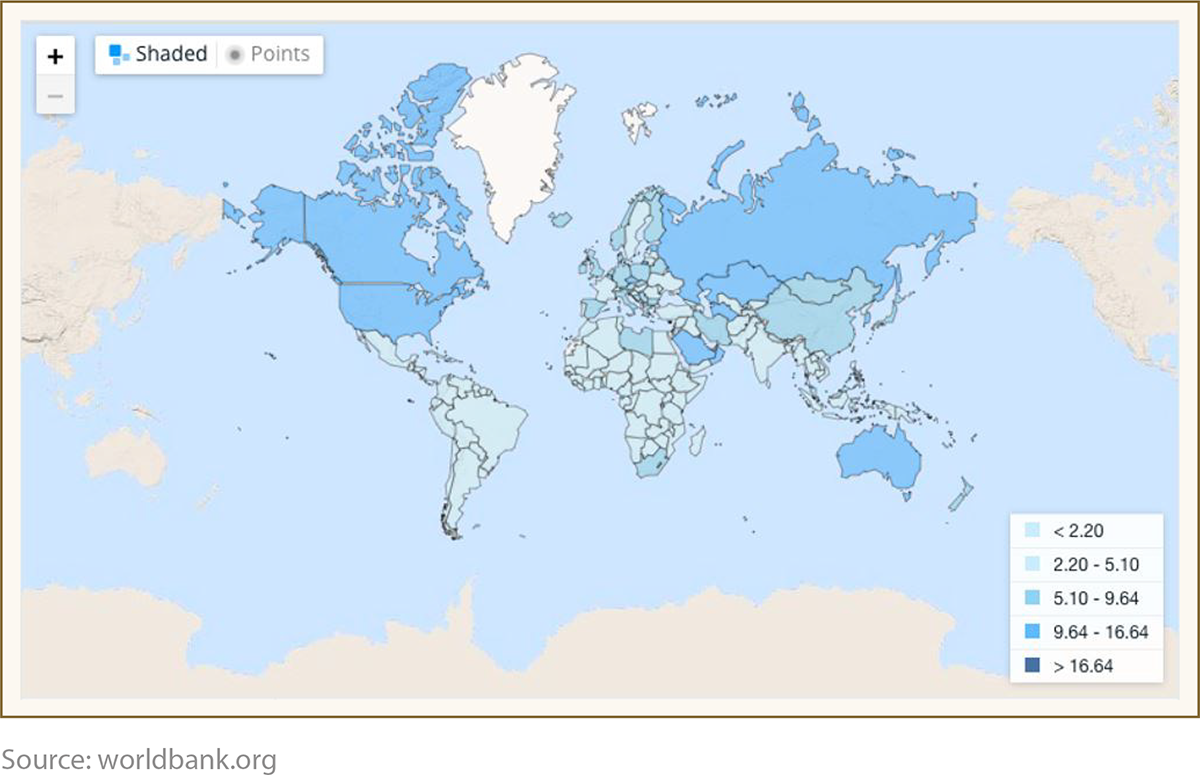
When this is converted to a ‘per capita’ basis, the chart changes considerably.
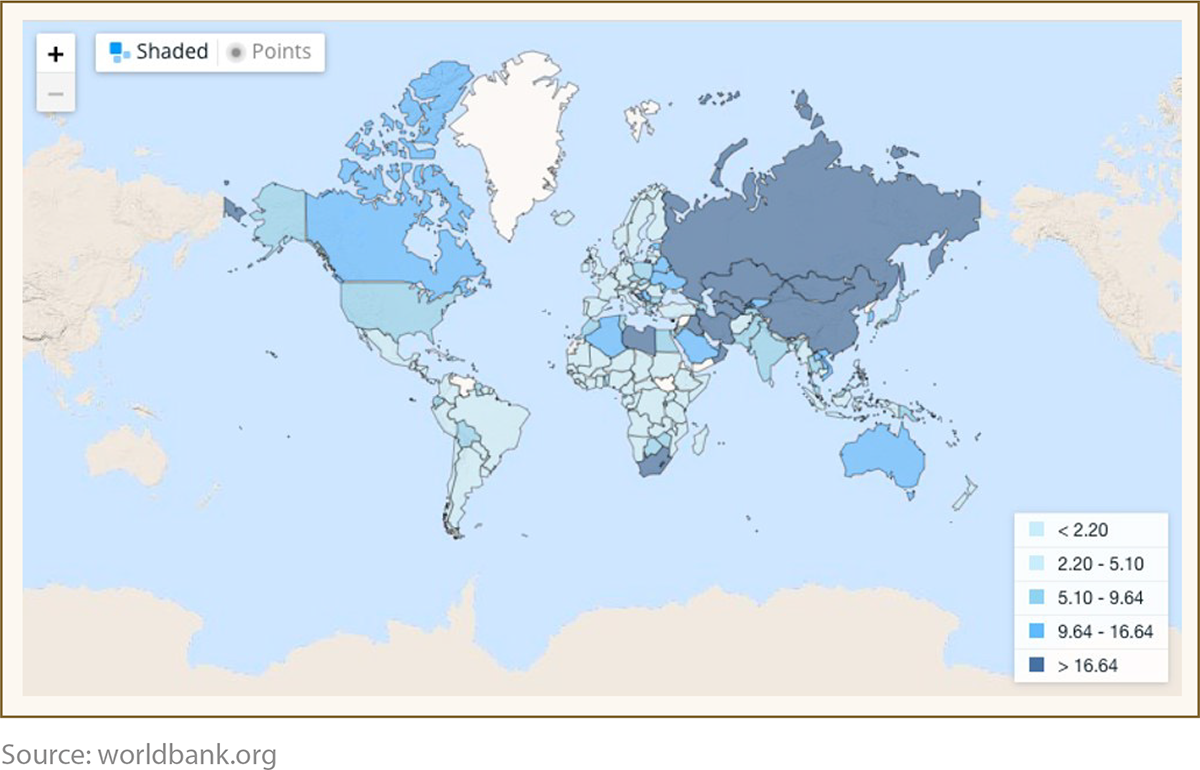
When converted again to CO2 per $PPPGDP – GDP in dollar terms normalized to an international standard (Purchasing Power Parity) using the price of a wide basket of goods as the normalizing factor.
Finally, CO2 per $GDP
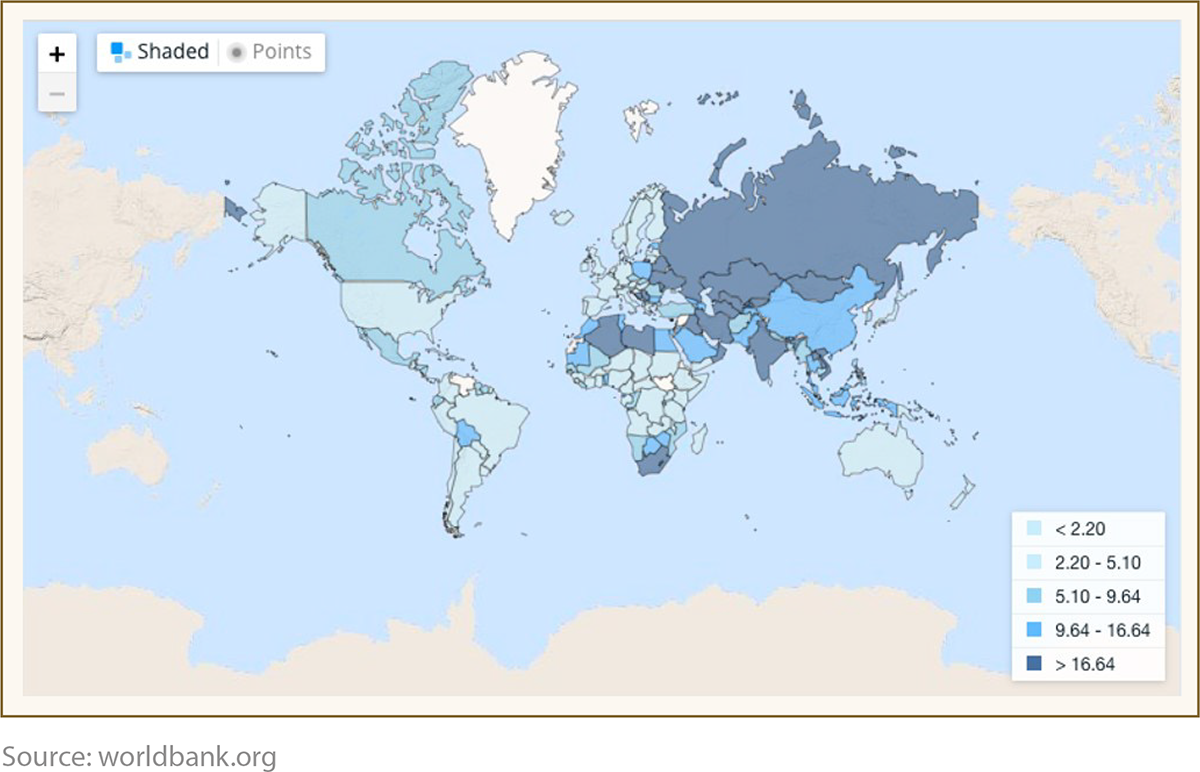
Of particular interest is the role of the US in terms of CO2 intensity, and how it change with the metric selected as the unit of division. With each successive change, from ‘pure emissions’ to ‘emissions per $GDP’, the country moves down an intensity grade.
This has clear ramifications as to the pathway to a greener economy that countries take, and their consequences on the wider global ambition of ‘net zero’ by 2050. Note that the US Department of Energy (DoE) uses the ‘CO2 per $GDP’ formulation.
The unit used by banks for their ‘Scope 3’ disclosure, is ‘CO2 per $m revenue’.
Even the definition of CO2 emissions is variable…
Carbon emissions in a particular activity is not a simple calculation. There are four commonly used definitions for this, with each having its specific pros and cons:
- Basic – Carbon emissions are calculated for a specific process only without considering GHGs involved in material production or end-of-life processes for those materials. This method is the simplest as it is self-contained, and avoids double counting of total carbon emissions. However, it tends to obscure the total carbon footprint of a product, potentially leading to a greenwashing effect.
- Well-To-Wheels (WTW) – Carbon emissions for specific processes, and any upstream activities that extract, refine, and deliver materials needed for the process. Notably, end-of-life process emissions are not included, which excludes decommissioning of plants and machinery. This is attractive as a carbon audit standard as it allows an industry such as vehicle manufacture to be segmented into manufacture, recovery, and disposal. This avoids double-counting along the specific chain but also leaves room for greenwashing certain activities.
- Life Cycle Assessment (LCA) – Carbon emissions are counted over the entirety of the process, from raw material extraction to end-of-life treatment. This is the most complete carbon audit, as it captures all emissions involved. Banks that finance multiple parts of the same supply chain may double count some emissions but the main issue is the complexity of the audit itself. There are a number of variables needed, such as the length of life of a plant or machine, which impacts the unit numbers and therefore the final ‘intensity’ number. End-of-life emissions also require estimates about processes outside of the control of the firm under audit.
- WTW-LCA Hybrids – Between the two lifecycle methods, there are a number of systems. These are designed to provide a consistent measure. An example is the inclusion of end-of-life treatment for batteries for electric vehicles. These schemes retain the WTW ease while attempting to avoid carbon undercounting within specific industries.
One such hybrid scheme is the Greenhouse Gases, Regulated Emissions, and Energy use in Transportation (GREET) model, which is used by the US DoE’s Office of Energy Efficiency and Renewable Energy. This allows a more comprehensive comparison of the relative environmental merits of different vehicle types.
More than just carbon is audited for CI computation…
CO2 is the most commonly referenced Greenhouse Gas (GHG). This is because it is the longest-lasting in the atmosphere, effectively meaning that every kg released into the atmosphere has a warming effect for centuries. Other gases, such as methane or nitrogen, have greater potency, but often remain in theatmosphere for far less time – for decades rather than centuries.
The nature of climate pathways and potential environmental ‘trigger points’, where positive feedback loops are activated by temperatures being temporarily above the target range, means that these gases must be accounted for. To include other GHGs, a scientific formulation is used that compensates for both the potency and longevity, effectively amortizing the effect over a time range. This results in the terminology ‘Carbon Dioxide or equivalent’(CO2e).
Banks must use ‘CO2e tonnes per $m revenue’ as their CI calculation base.
The Bank for International Settlements (BIS) issued guidance for syndicated loans on this topic in June 2021.
With the banking metric understood, data needs to be interpreted…
As mentioned in an earlier section, each industry uses a specified unit for its own reported CI. When calculating their own ‘Scope 3’ disclosures, banks must be able to disentangle the reported numbers they obtain from their customers. Below is a range of unit descriptions, as reported by the Bank of England (BoE) in their own disclosure documents.
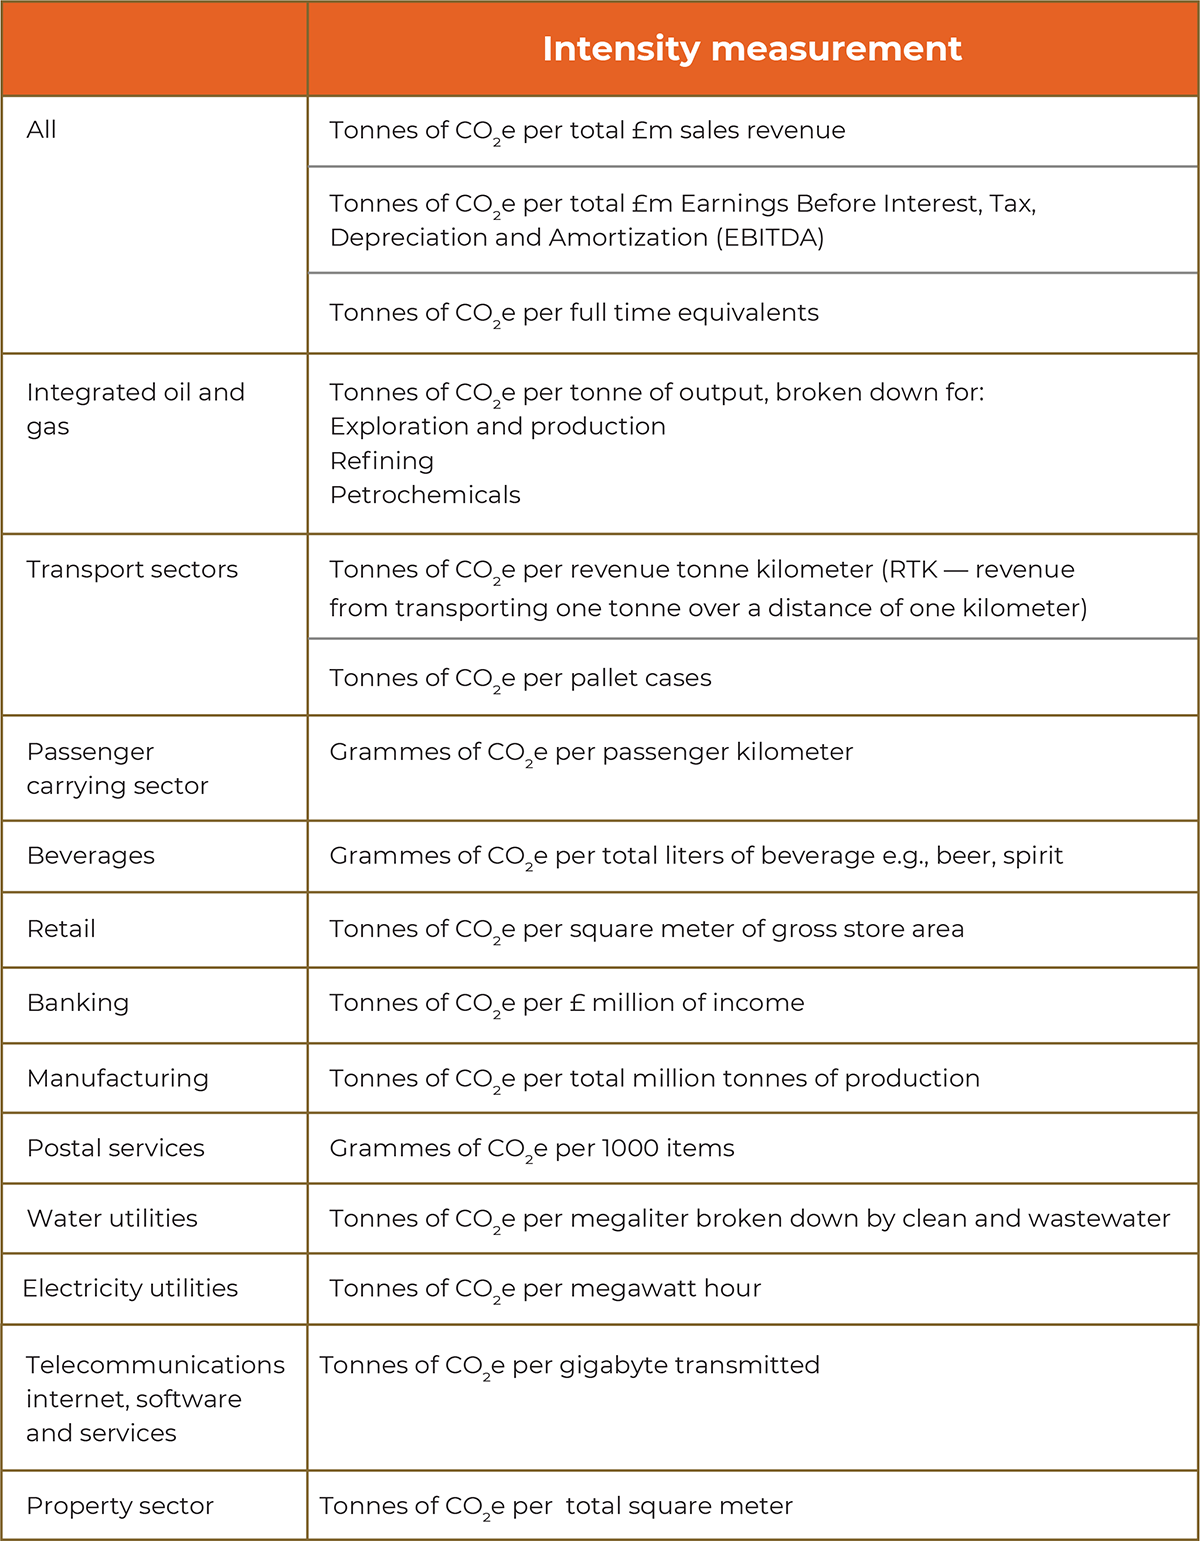
In order to properly understand the levels of GHG being financed by the bank, they should break down the available data and report on the following:
- Sector level CI benchmarks and values for assets on the balance sheet
- Bank-level CI
- Explanatory notes on CI formulation
- Explanatory notes on sector level CI factors
In addition to carbon disclosures, the above information is used for:
- Internal climate risk governance
- Inclusion of climate change in risk reporting
- Determination of likely climate strategy paths to be encoded into risk scenarios and stress testing
It is with regard to stress testing that the calculated outputs become most useful for financial risk management. Climate pathways are determined by the International Panel for Climate Change (IPCC) and are designed to represent valid routes to preset global warming targets. Individual governments commit to their own targets, based in part, on these pathways. The priority of climate action within each nation will differ according to their own emission profile and metrics. Understanding how a government views its national emissions is a useful indicator as to the speed of transition within each area and alters the likely impact on business models within specific sectors. These impacts will determine the likely credit profile of firms within these sectors and those that represent the banks’ customers.
Strategies to deal with increased credit risks faced by the bank as a lender, and advisory services provided by the bank around climate adaptation, are determined by these pathways and resultant risk profile changes.
GreenCap can help…
GreenCap is a ‘Risk as a Service’ (RaaS) solution, designed to determine the risk-based capital increases a bank will face as the green economic transition progresses. The solution translates climate science into recognizable risk management outputs based on IPCC pathways and well-understood risk metrics.
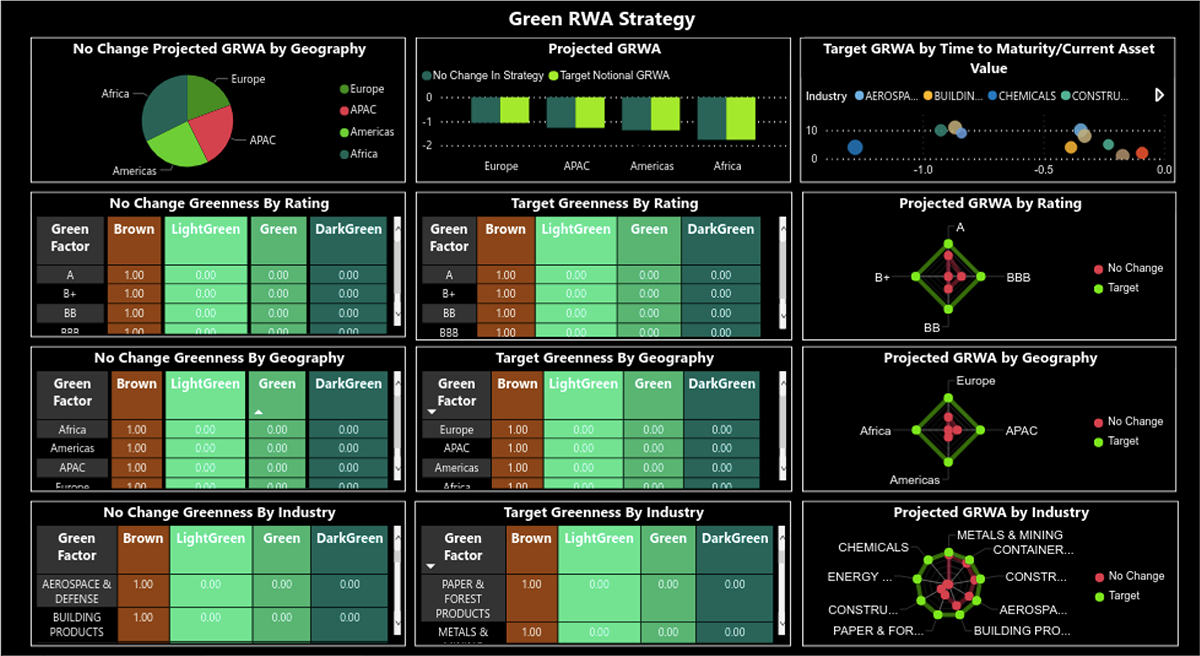
With GreenCap, banks can expand their risk management frameworks to include climate change in their risk governance and reporting. They are also able to ensure that assets are priced in a way that reflects these increased risks, enabling climate advisory services to be provided, with the explicit aim of becoming a key part of the global warming solution.