Banks struggling to create economic scenarios to replicate climate pathways ought to review the recent Whitehouse whitepaper on how they are incorporating climate change into their own budget forecasting. This may prove invaluable for evaluating their own potential climate-related credit costs and avoid future liquidity issues.
The US government has been more active in the climate space recently…
The current administration has been on a mission to put America on a ‘net zero’ path, which includes multiple executive actions designed to steer the economy in a ‘green’ direction. These are not limited to, but include:
- 20th January 2021 – Newly inaugurated, President Biden signs the official instrument to put the US back into the Paris Accord
- 19th February 2021 – US officially rejoins Paris Accord
- 22nd April 2021 – US submits revised ‘Nationally Determined Contribution’ (NDC) to the UN
- 16th August 2022 – US signs the ‘Inflation Reduction Act’ into law, including $391b on clean energy and climate change
- 13th March 2023 – Whitehouse releases its ‘Methodologies and Considerations for Integrating the Physical and Transition Risks of Climate Change Into Macroeconomic Forecasting for the President’s Budget’, explaining how costs of the administration’s climate policies could be calculated
The above actions may have restored the US’s standing in the eyes of the United Nations Framework Convention on Climate Change (UNFCCC), but they also represent a significant economic directional change, and as such, banks need to study both the policy changes and the estimated costs. A drastic switch away from a fossil fuel-powered ‘brown’ economy will have severe implications for the businesses and households that make up their balance sheets and loan books. This has the capacity to deteriorate credit profiles, increasing banks’ credit risk and their need to hold economic capital against it. The more capital that needs to be held in reserve, the less profitable the bank, and the more likely it becomes of breaching liquidity floors.
To plan for potential credit shocks and to prevent these from becoming liquidity events, risk departments must look into the ambitions and costs of ‘net zero’ plans.
US NDC goes far, but more may be needed…
The United State of America
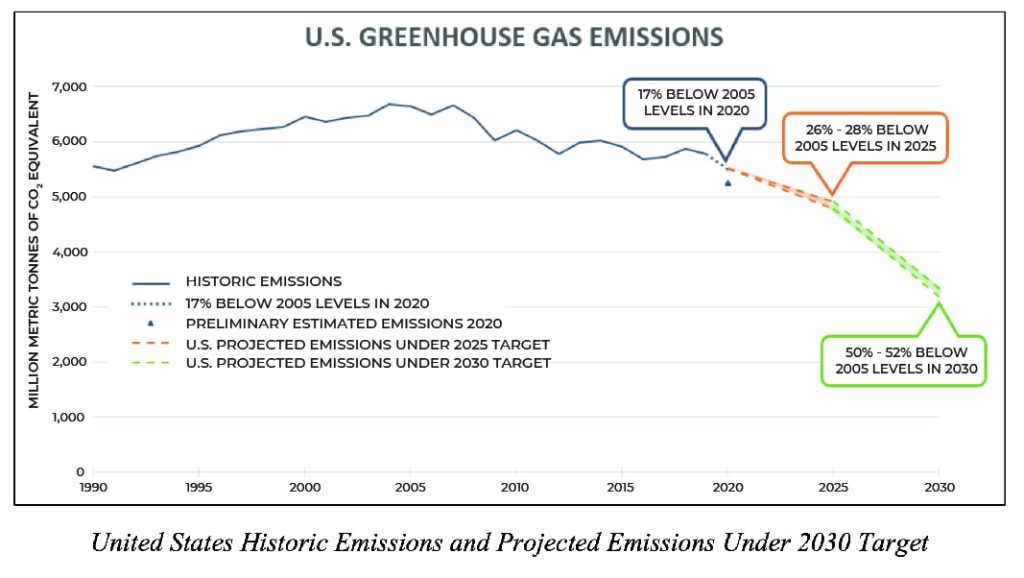
The US government has made a commitment to reduce CO2e emissions (CO2 or equivalent greenhouse gas) to 50-52% of 2005 levels by the year 2030.
The principle targets for change within the NDC are:
- Electricity : The United States has set a goal to reach 100 percent carbon pollution-free electricity by 2035
- Transportation : Policies to reduce CO2 from the transportation sector will include
- tailpipe emissions and efficiency standards
- incentives for zero-emission personal vehicles
- charging infrastructure to support multi-unit dwellings, public charging, and long-distance travel
- Buildings : The emissions reduction pathways for buildings consider include –
- support for energy efficiency and efficient electric heating and cooking in buildings via funding for retrofit programs
- wider use of heat pumps and induction stoves
- adoption of modern energy codes for new buildings
- Industry : Policies will incentivize –
- carbon capture
- new sources of hydrogen – produced from renewable energy, nuclear energy, or waste
- Agriculture and lands : This will include –
- scaling of climate-smart agricultural practices
- Reforestation
- rotational grazing
- nutrient management practices
This document should be used as guidance in all top-down economic scenario building.
Pricing of policy pathways is a major hurdle for risk departments…
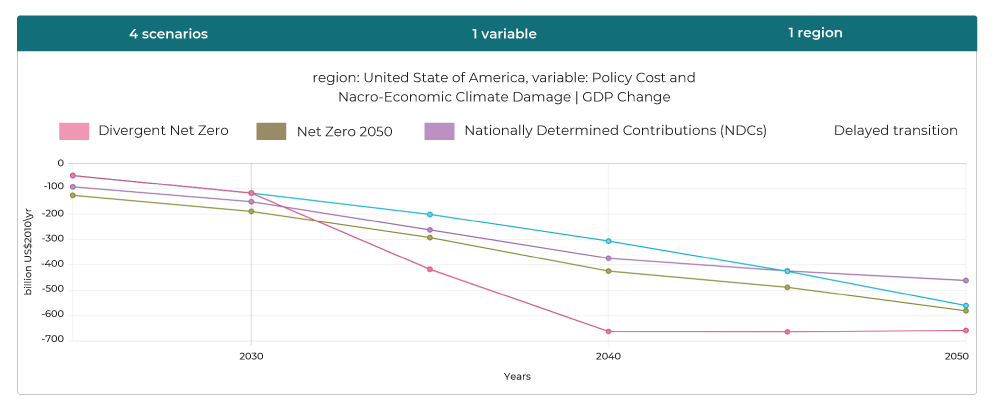
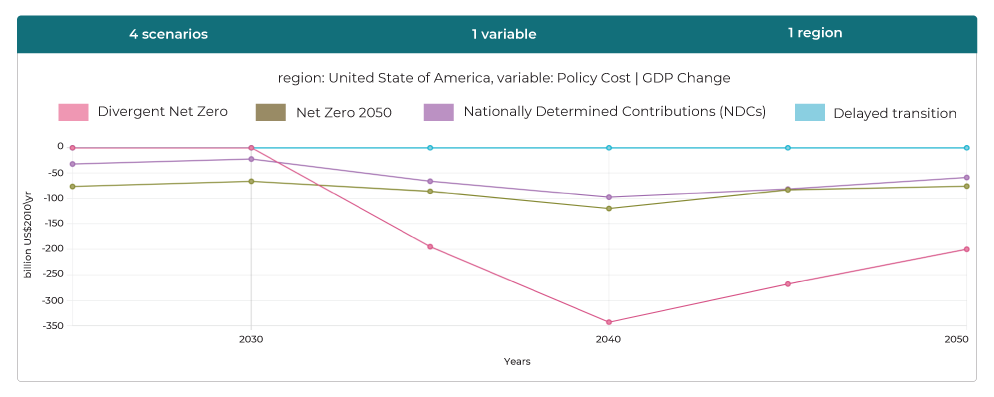
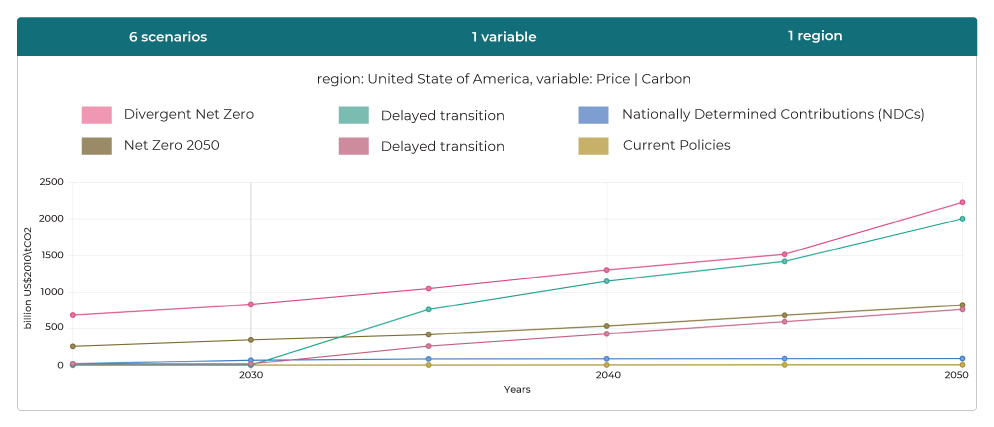
From an external perspective, the ‘Network for Greening the Financial System’ (NGFS) can be used as a resource to obtain pathway costs. The group has researched multiple potential scenarios per country, including:
- Current policies – Assuming actual policies currently in place are not built upon, but are enacted
- NDC – Assuming the commitments stated within the NDC are met on the timescales indicated
- NDC delayed – Assuming a two-year delay in implementation of NDC plans
- 2-degree limit – Assumes a scaling up from the NDC towards a ‘fair share’ CO2e reduction to meet a globally agreed target of limiting global warming to 2 degrees by 2100
- 1.5-degree limit – Assumes a scaling up from the NDC towards a ‘fair share’ CO2e reduction to meet a globally agreed aspiration of limiting global warming to 1.5 degrees by 2100
All of these consider both transitional (policy) and physical (damage) costs that are estimated by the NGFS for each scenario.
Notably, the NGFS treats countries as single units, including the US. This approach may develop
errors as the size of the country and distribution of its industrial and agricultural assets are suited to
a more intra-regional way of thinking.
The administration has published ways its policies can be costed out…
This document considers multiple methodologies that can be used to include transitional costs and physical damage estimates in the 10-year economic forecast and the ‘Long-Term Budget Outlook’ (LTBO). This includes appropriate measures to use, such as ‘debt to GDP’, as well as actual econometric methodologies.
Both physical and transitional factors are taken into account with listed physical factors including:
Table 2: Examples of pathways by which climate change can affect macroeconomic variables
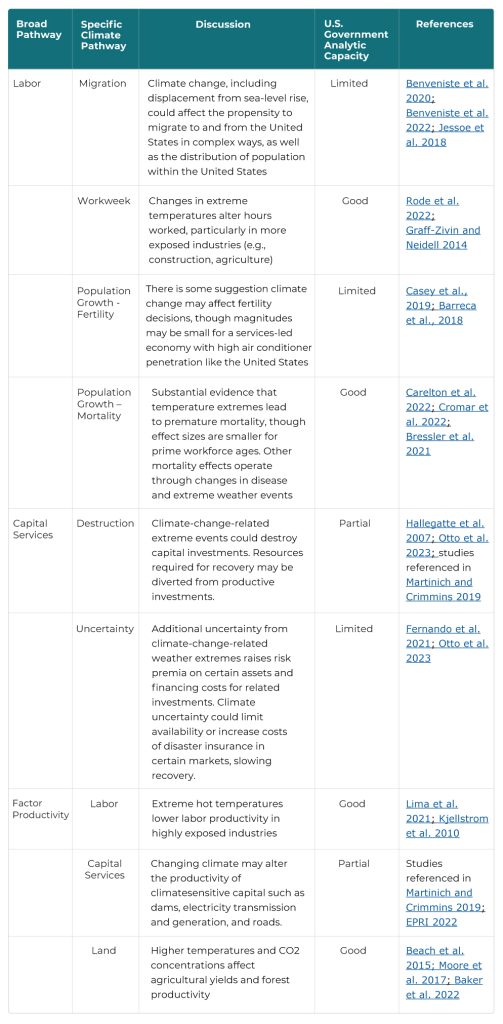
Note: Modeling capacity definitions: “None” = potential pathway not quantified or modeled; “Limited” = pathway has been fully or partly modeled in the academic literature, but adapting results for Budget forecasting purposes remains challenging; “Partial” = capacity exists to quantify some but not all of these effects; “Good” = capacity exists to quantify the bulk of these effects and/or used in existing U.S. Government work
Transitional factors are also listed, including:
Table 3: Examples of pathways by which the energy transition can affect macroeconomic variables
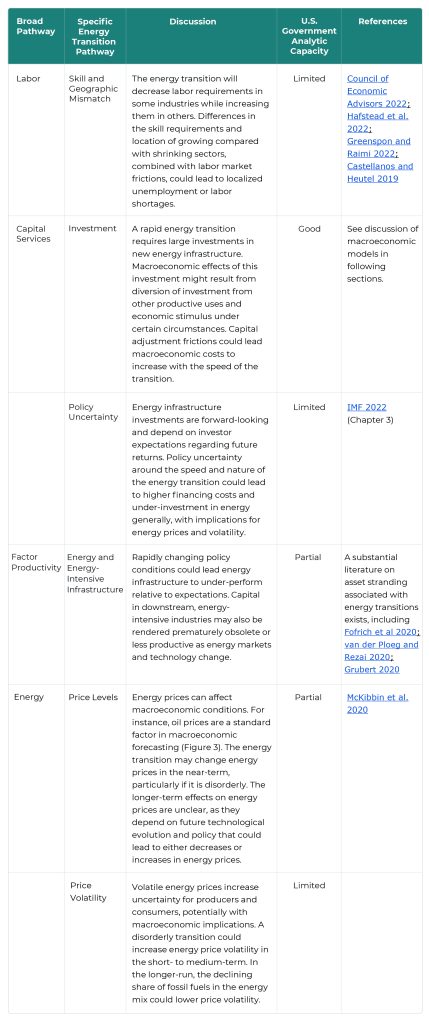
Note: Modeling capacity definitions: “None” = potential pathway not quantified or modeled; “Limited” = pathway has been fully or partly modeled in the academic literature, but adapting results for Budget forecasting purposes remains challenging; “Partial” = capacity exists to quantify some but not all of these effects; “Good” = capacity exists to quantify the bulk of these effects and/or used in existing U.S. Government work
The requirements for viability are that these factors are incorporated into the model as well as:
- Model has been properly peer-reviewed
- Sub-national level results within the US
- Includes capital and labor frictions
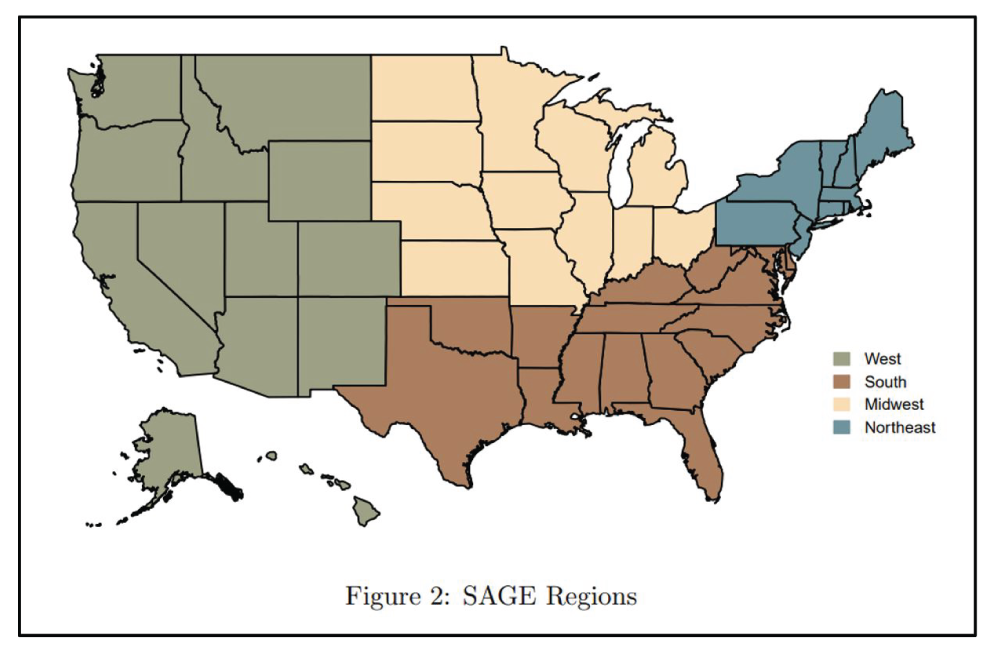
While some models produce state-level results, one, EPA-SAGE divides the country into four regions for analytic purposes.
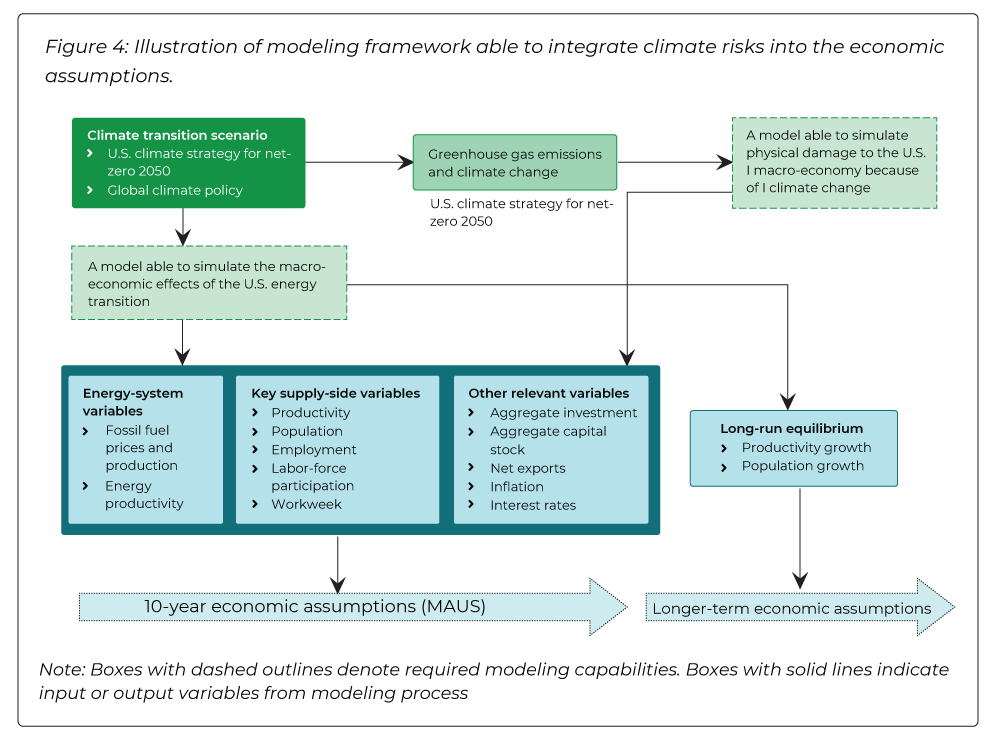
The general framework for modeling climate risks econometrically is summarized as follows:
It is incumbent upon banks to extend budget thinking into stress scenarios…
The previous sections summarize how the administration is developing and pricing its climate policy. This thinking must be adopted by banks in order that they develop scenarios that are able to expose upcoming credit risks to their own loan books and balance sheets, with a view to building contingency plans to avoid the resultant liquidity shocks.
To do this, they will need to:
- Identify top-down industry-level impacts
- Decide on an approach to price these impacts nationally and regionally
- Detail any adaptations that are specified or implied by the transitional policies of industry
- Convert the pricing into a credit risk measure
Once such a framework is built, transitional and physical costs can be attributed by applying a general top-down approach, but adjusting at the loan level according to investments/adaptations already made by the borrower.
While challenging, once built, climate risks could be calculated and reported alongside market, credit and liquidity risks, and included in the overall risk framework and appetites.
Building climate into banks’ risk management frameworks has been covered in:
And climate scenario construction has been covered in:
GreenCap can help…
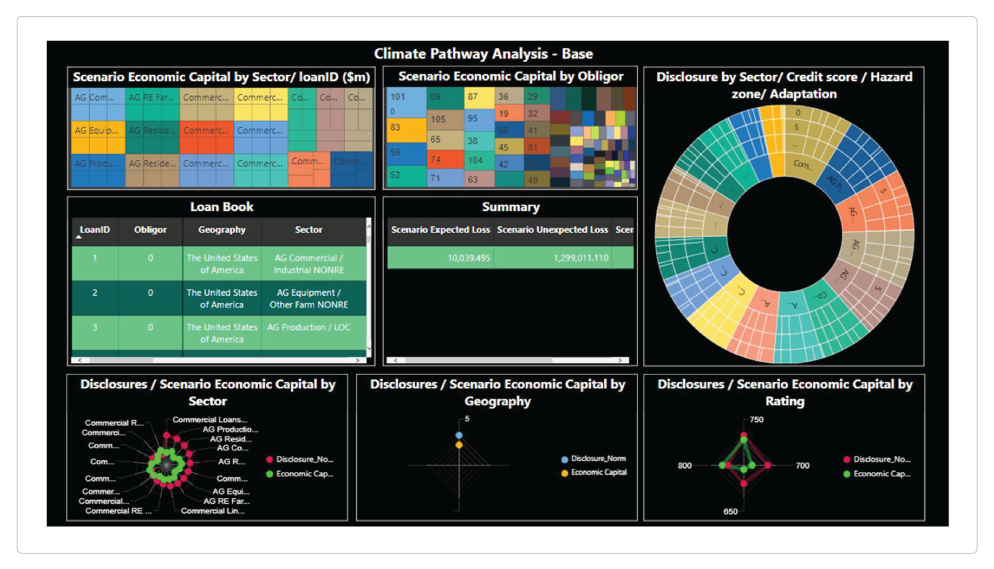
GreenCap is a ‘Risk as a Service’ (RaaS) solution that gives banks the capacity to build meaningful climate scenarios that mirror multiple climate pathways and stress test their balance sheets.
The results produced by the system include:
- Changes, by scenario, in borrower risk ratings
- Implied spreads, by loan, needed to make up borrower credit deterioration under each scenario
- Increases in economic capital, broken into expected and unexpected losses
- Analytics, targets and limits by industrial sector, geography or rating
GC main screen (retail – US latest)
GC scenario screens (US latest)
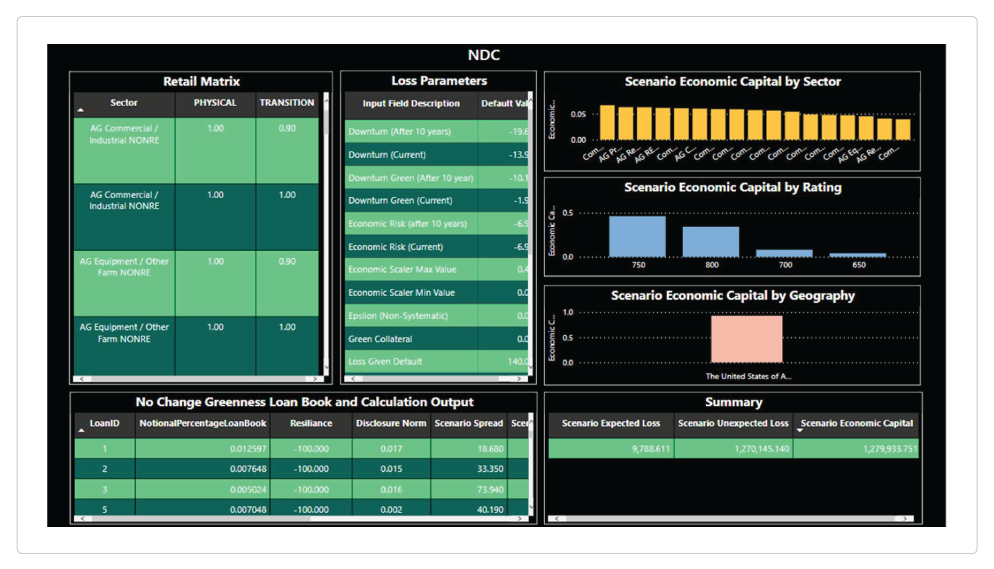
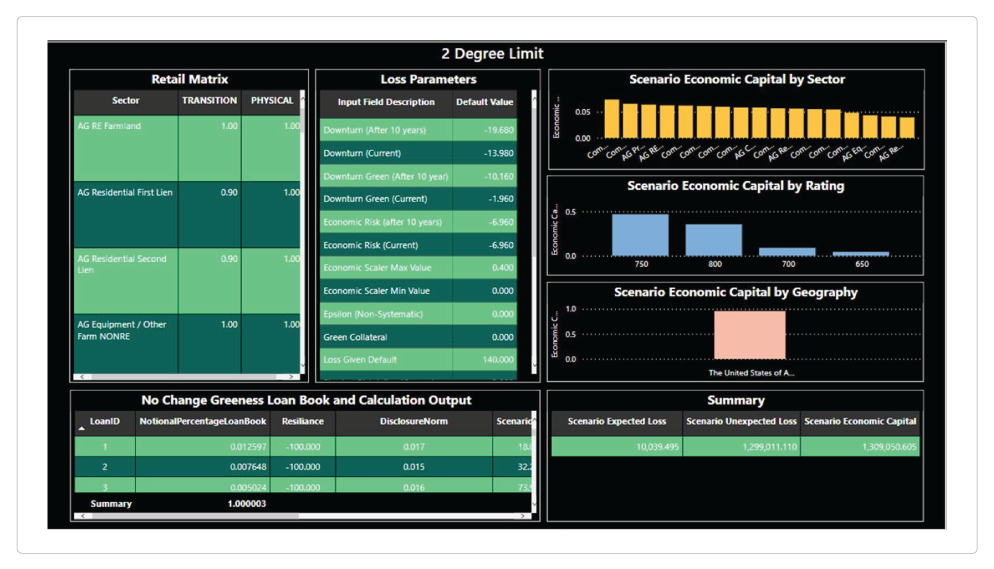
GreenCap is designed to fill the gap in risk frameworks that need deterministic climate stress tests in a way that can be transparently used by the risk governance committee to properly manage risks that climate change will create, both physical and transitional.
Visit GreenCap.live for more insights and resources, curated for use by banks aiming to add climate risk to their existing risk frameworks.