The Recent Australian Election Highlights the Need for Banks to be Prepared for Transition Volatility, and to Construct Climate Scenarios Accordingly, Or Risk Mispricing Their Loan Book.
Climate scenarios differ markedly from traditional banks’ stress testing…
Climate scenarios are essential for banks to properly stress test the ‘riskiness’ of their current
balance sheets, but the creation of these scenarios is far from simple. From high-level climate
‘Pathways’ to policy-based regional ambitions, there is a great deal to take into account in the
make-up, including:
- Global climate ambitions agreed to by governments around the world
- Regional targets set and monitored by the same governments
- Differential pressures on food and energy security
- Upstream and downstream supply chain effects
- Worsening climate outcome predictions impacting the speed of transition
- Split of the climate investments between adaptation and mitigation
All of these need to be reflected in a rigorously designed scenario.
Global ambitions are the best starting point…
As part of its remit from the UN, The Intergovernmental Panel on Climate Change (IPCC) creates
a range of Representative Concentration Pathways (RCPs). These represent routes through the
century towards outcomes, expressed in terms of the final increase in average global surface
temperature, relative to pre-industrial measurements. The main pathways considered are:
- 1.9 – Endpoint – a rise of 1.5 degrees or less
- 2.6 – Endpoint – a rise of 2 degrees or less
- 4.5 – Endpoint – a rise of 3 to 4 degrees
- 8.5 – No action, commonly called ‘Hot House World’
It is important to appreciate that these pathways are ‘real world’ based and presented to the
regular UN ‘Conference of the Parties’ (COPs), at which the assembled governments agree on
global ambitions to meet, or attempt to meet, specific outcomes. The key here is that this is a
collective goal.
Various attempts have been made to deconstruct the collective goal into regional sub-goals,
along with allocated targets, but these have failed. The current protocol is for individual countries
to then publish their own individual aims, and be responsible for monitoring and reporting
progress to the following COP. The net result is that there is no direct connection between the
communal goal and the sum of the underlying individual goals.
As an example of this, an analysis of the last COP in Glasgow showed:
- The communal aim was to hold global warming to 2 degrees
- The stretch aim was to hold global warming to 1.5 degrees
- The analyzed end-point of existing published policies would see a rise of 2.7 to 3 degrees
Three simultaneously held yet contradictory ambitions.
More granular analysis allows for more detailed scenarios…
With all of that said, the start point of a global scenario still has to be the IPCC. It is the most widely
recognized and researched, yet is just a starting point. Other bodies, most notably the
International Energy Agency (IEA) and the Network for Greening the Financial System (NGFS)
provide breakdowns that are more specific to industries and can be costed out more effectively.
Importantly, the NGFS also breaks down climate pathways and policy initiatives by country,
including metrics such as:
- No action by the government
- Current policy in place
- Stated regional policy ambitions
- GDP impact by year through the transition
- Commodity prices
- Energy pricing
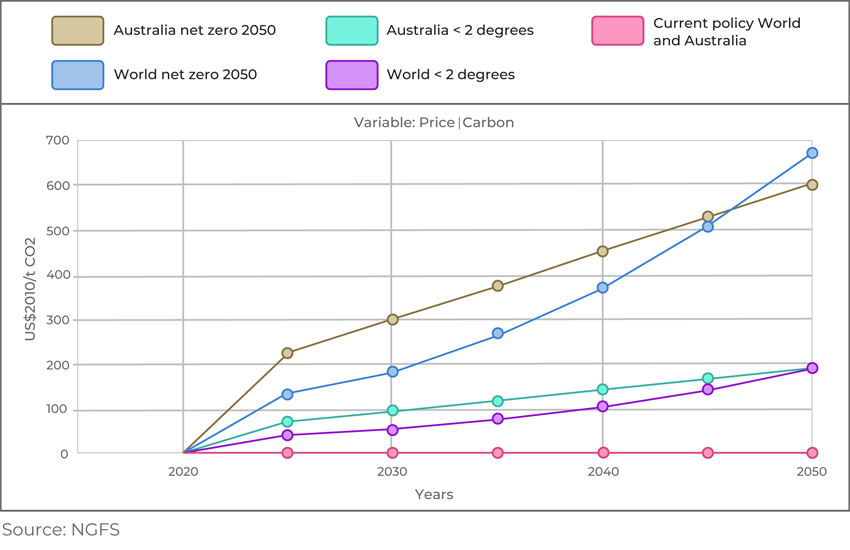
One of the most important techniques that the NGFS adopts, is the use of a theoretical carbon
price as a proxy for the cost of pathways and scenarios that are either based on regional plans or
global outcomes. This allows for standardized comparison between regional transition journeys.
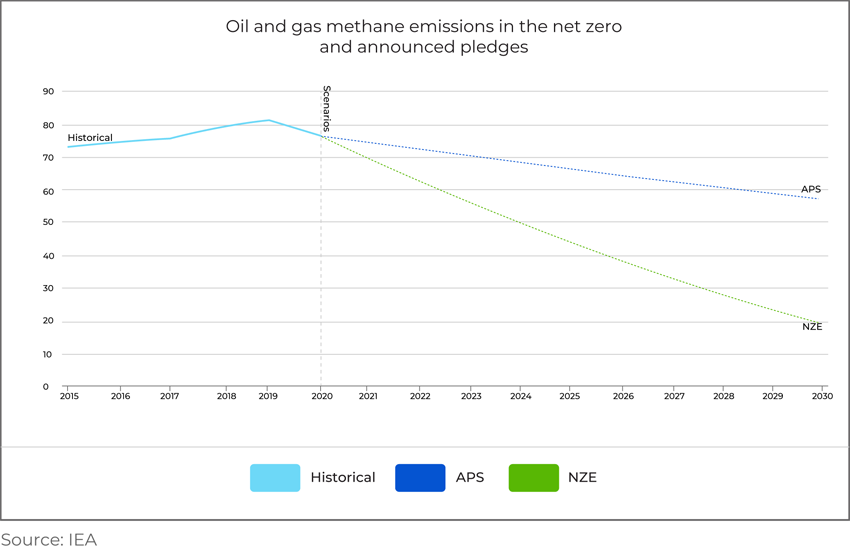
The IEA also analyzes the global economy from a ‘brown to green’ energy perspective. While not
covering the agricultural sector, they do provide detailed progress reporting against their own
‘Net Zero Emissions by 2050 Scenario’ (NZE), which itself is in line with the various pathways as a
necessary milestone. Sectors specifically covered by the analysis include:
- Power
- Fuel supply
- Industry
- Transport
- Buildings
- Energy Integration
Each of these areas is further sub-divided into 46 specific analytic topics and tracked against
that sector’s progress towards net zero. This analysis is presented as adaptations needed, in each
sector specifically, and whether or not those are being introduced at a pace that will meet the
2050 goal.
The usefulness of this analysis is that it indicates not only how far the global economy is from
being on track to a greener future, but how steep and disorderly the correction would need to be.
This type of scenario adjustment is important for risk managers to build meaningful, defensible,
economic scenarios.
Similar to the IEA, the ‘Climate Action Tracker’ (CAT) also breaks down current country-level
pledges, measuring them against the UN agreed goals of a 2-degree limit with best efforts
towards 1.5 degrees. The results are presented globally and locally by each country.
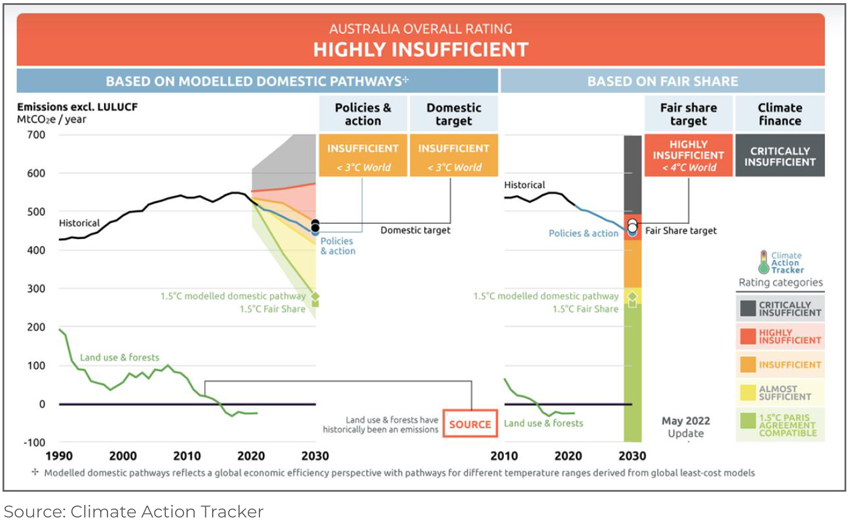
As the IEA provides insights into the likely steepening of the transition curve, CAT allows scenario
builders within banks to adjust local level speeds and urgencies.
Scenarios must be a mixture of art and science…
It is clear that there is a plethora of deeply-researched data that covers pathways to various climate
outcomes, from a specific industry, progress through proxy carbon pricing to estimated annual
GDP impacts.
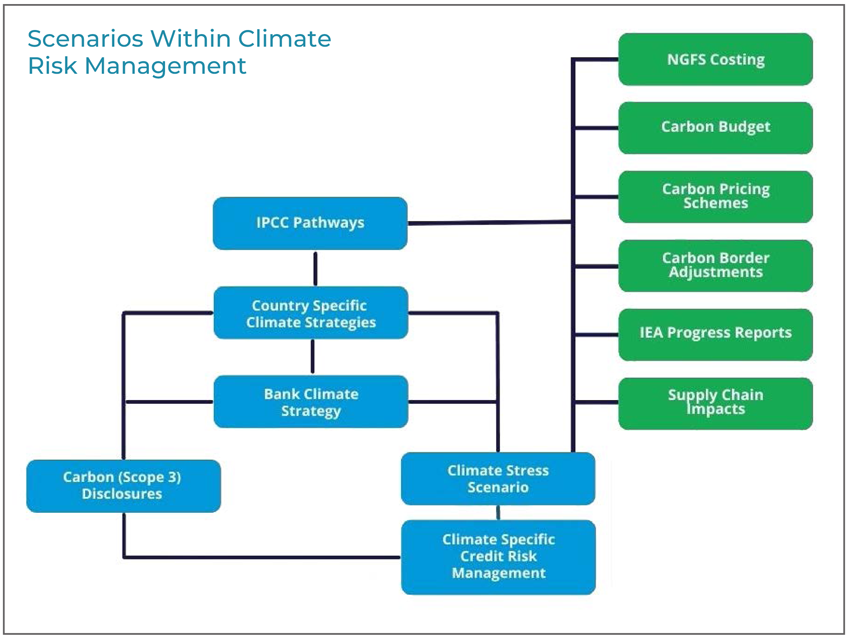
For all of this data to become truly useful to banks, economic scenarios must combine the known
elements of the analysis:
- High-level commitment – Indicating the pathway being tracked against
- Local commitments – Policies that have been put in place
- Stated ambitions – Policies that have been flagged but not put in place
- Climate indicators – Global measurements of climate change that increase the pressure to go
- further in policy
- Global supply chain indicators – How impacts on target industries are likely to affect their
- specific supply chains
- Costs – Researched estimates of the costs of each pathway
- Industry-specific indicators – Global progress within specific sectors
Within the above, there are such things as carbon taxing and carbon border adjustments, both of
which carry policies from one region to another, impacting firms in both.
The final scenario(s) must be a blend of overall economic impact, typically expressed through GDP
changes, and speed of transition adjustments.
It is also vitally important to keep in mind that some firms within economies will take adaptive
steps to protect themselves against both transitional and physical climate change. Including the
potential adaptations by industry, and factoring these into the analysis at an as granular level as
possible, will create a set of scenarios that can inform a bank as to the likely impact of each
pathway on its underlying book.
In the case of Australia, the shape of transition curves will change markedly as a government
comes into power, with sustainability as a keystone policy initiative. The case for rapid change has
been made and therefore it is likely that the country moves closer towards tracking the 2-degree
target. With a robust scenario framework and system in place, the effect this will have on credit
profile of the bank balance sheet could be reflected, informing lending strategy, putting the bank
in a strong position to take advantage of opportunities it brings, as well as protecting itself from
implied increased risks.
GreenCap can help…
GreenCap is a Risk as a Service (RaaS) solution that enables banks to quantify the increased risks
they will face as the global economy moves from a brown to a green basis.
Intuitive scenario building provides economic inputs to sit alongside obligor-specific adaptations,
to make a rich, multi-dimensional approach to the task of building meaningful, tractable,
scenarios.
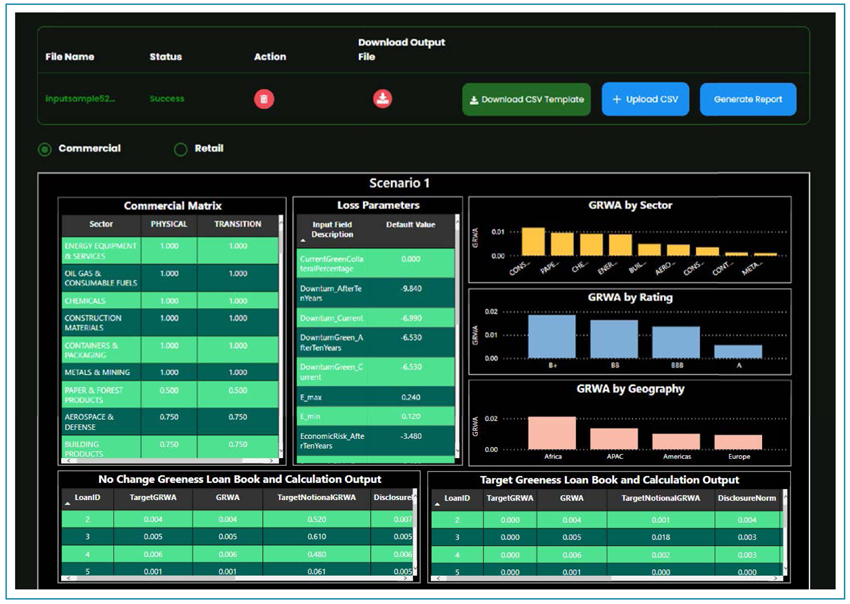
GreenCap allows multiple scenarios to mirror the pathways and analysis from international
bodies such as the IPCC, IEA, and NGFS. Adaptation options are built in at the loan level, to give
the most accurate picture possible of the portfolio and its risk outlook.
Visit Greencap.live for more insights and to discover resources that have been curated for banks
to have access to the most important information they need during early days of the transition.